
Visual Query Plan Analyzer
Slow mobile database queries drain battery and cause UI frame drops. VetroLog’s Visual Query Plan transforms cryptic SQLite EXPLAIN QUERY PLAN logs into an intuitive, visual tree structure.
🔍 Why Visual Query Plans Matter on Mobile
Running EXPLAIN QUERY PLAN natively in SQLite returns raw, hard-to-read tabular text:
0|0|0|SCAN TABLE orders0|0|0|USE TEMP B-TREE FOR GROUP BY0|1|1|SEARCH TABLE customers USING INDEX idx_cust_id (id=?)VetroLog parses these records into a hierarchical DAG (Directed Acyclic Graph), assigning cost categories and visual alerts to every operation node.
graph TD A["Query Execution Root"] --> B["SCAN orders <br/>⚠️ High Cost Full Table Scan"] A --> C["TEMP B-TREE FOR GROUP BY <br/>⚡ Memory Temp Index"] A --> D["SEARCH customers USING INDEX idx_cust_id <br/>✅ Optimal Index Lookup"]🎨 Visual Cost Alert Categories
Each node in the query plan tree is highlighted with a clear status indicator:
| Alert | Node Type | Meaning & Performance Impact |
|---|---|---|
| 🔴 High Cost Alert | SCAN <table_name> | Full Table Scan: SQLite is iterating through every single row in the table because no usable index exists. Causes major lag on large tables! |
| 🟡 Warning Alert | TEMP B-TREE | Temporary B-Tree: SQLite created an in-memory B-Tree to satisfy an ORDER BY or GROUP BY clause. Consumes memory and CPU cycles. |
| 🟢 Optimal | SEARCH <table_name> USING INDEX | Index Lookup: SQLite accessed records directly via a B-Tree index in $O(\log N)$ time. Ideal performance. |
| 🔵 Info | COMPOUND / SUBQUERY | Correlated or uncorrelated subquery execution branch. |
🚀 How to Inspect a Query Plan
- Enter your SQL query in the SQL Playground.
- Click the Explain Plan button (or switch to the Visual Plan tab in the bottom panel).
- VetroLog renders the step-by-step operator hierarchy.
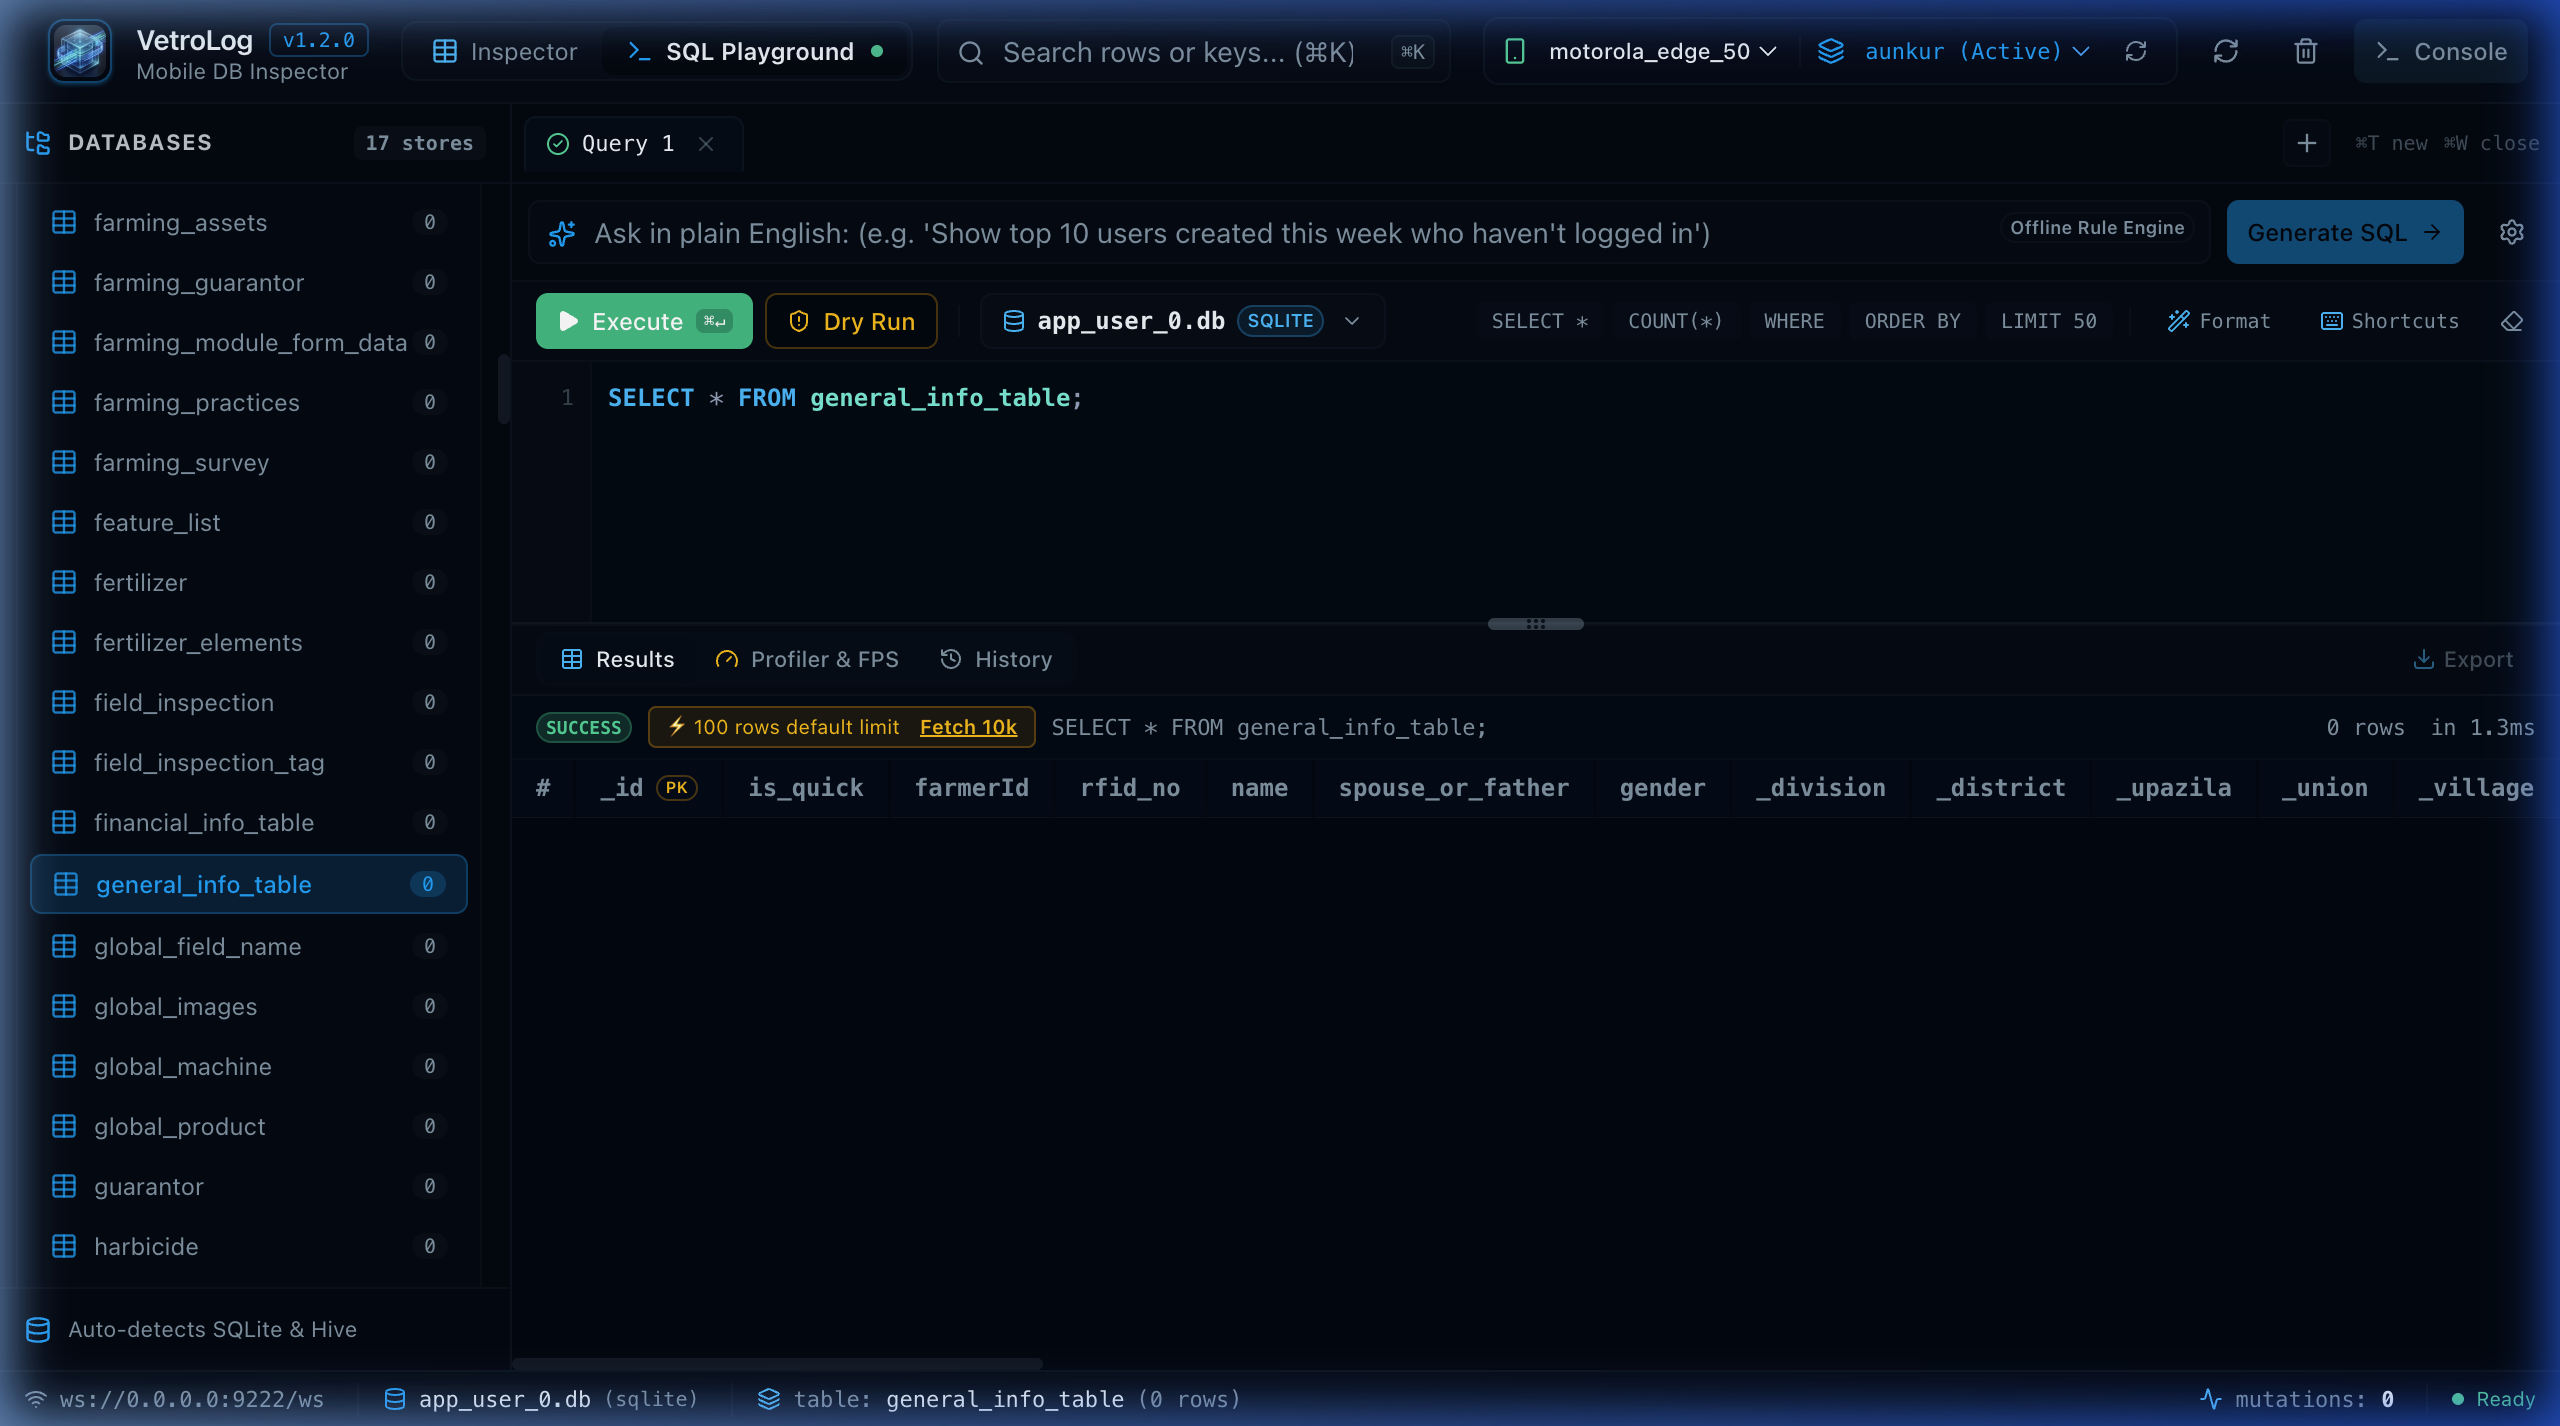 4. If a
SCAN node is detected, click on the 1-Click Index Advisor to instantly generate the missing index!
Next Steps
- Use the 1-Click Index Advisor to fix slow
SCANqueries with optimal indexes. - Check query latency against the 60 FPS mobile budget in the Performance Profiler.