Quick Start (3-Minute Tutorial)
Get started with VetroLog and inspect your real-time mobile database in 3 minutes.
Step 1: Enable USB Debugging on Your Device
VetroLog communicates directly with Android devices via the Android Debug Bridge (ADB).
For Physical Android Phones:
- Open Settings on your phone.
- Tap About Phone and locate the Build Number.
- Tap Build Number 7 times until you see the message: “You are now a developer!”.
- Return to Settings > System > Developer Options.
- Enable the USB Debugging toggle.
- Connect your phone to your computer with a USB cable.
- Accept the “Allow USB debugging from this computer?” dialog on your phone screen.
Verify your device is recognized by running:
adb devicesYou should see your device ID with the device status:
List of devices attachedZD222RN8B5 deviceStep 2: Launch Your App in Debug Mode
VetroLog accesses database files through Android’s secure run-as utility, which is enabled for apps compiled with android:debuggable="true":
- Flutter:
Terminal window flutter run - React Native:
Terminal window npx react-native run-android - Native Android (Kotlin / Java): Click the Run (▶) button in Android Studio.
Step 3: Connect & Inspect in VetroLog
- Launch VetroLog.
- Notice the top header bar:
- Device Selector: Automatically selects your connected device (e.g.
📱 motorola_edge_50). - App Package Selector: Automatically highlights debuggable apps on your phone (e.g.
📦 aunkur (Active)).
- Device Selector: Automatically selects your connected device (e.g.
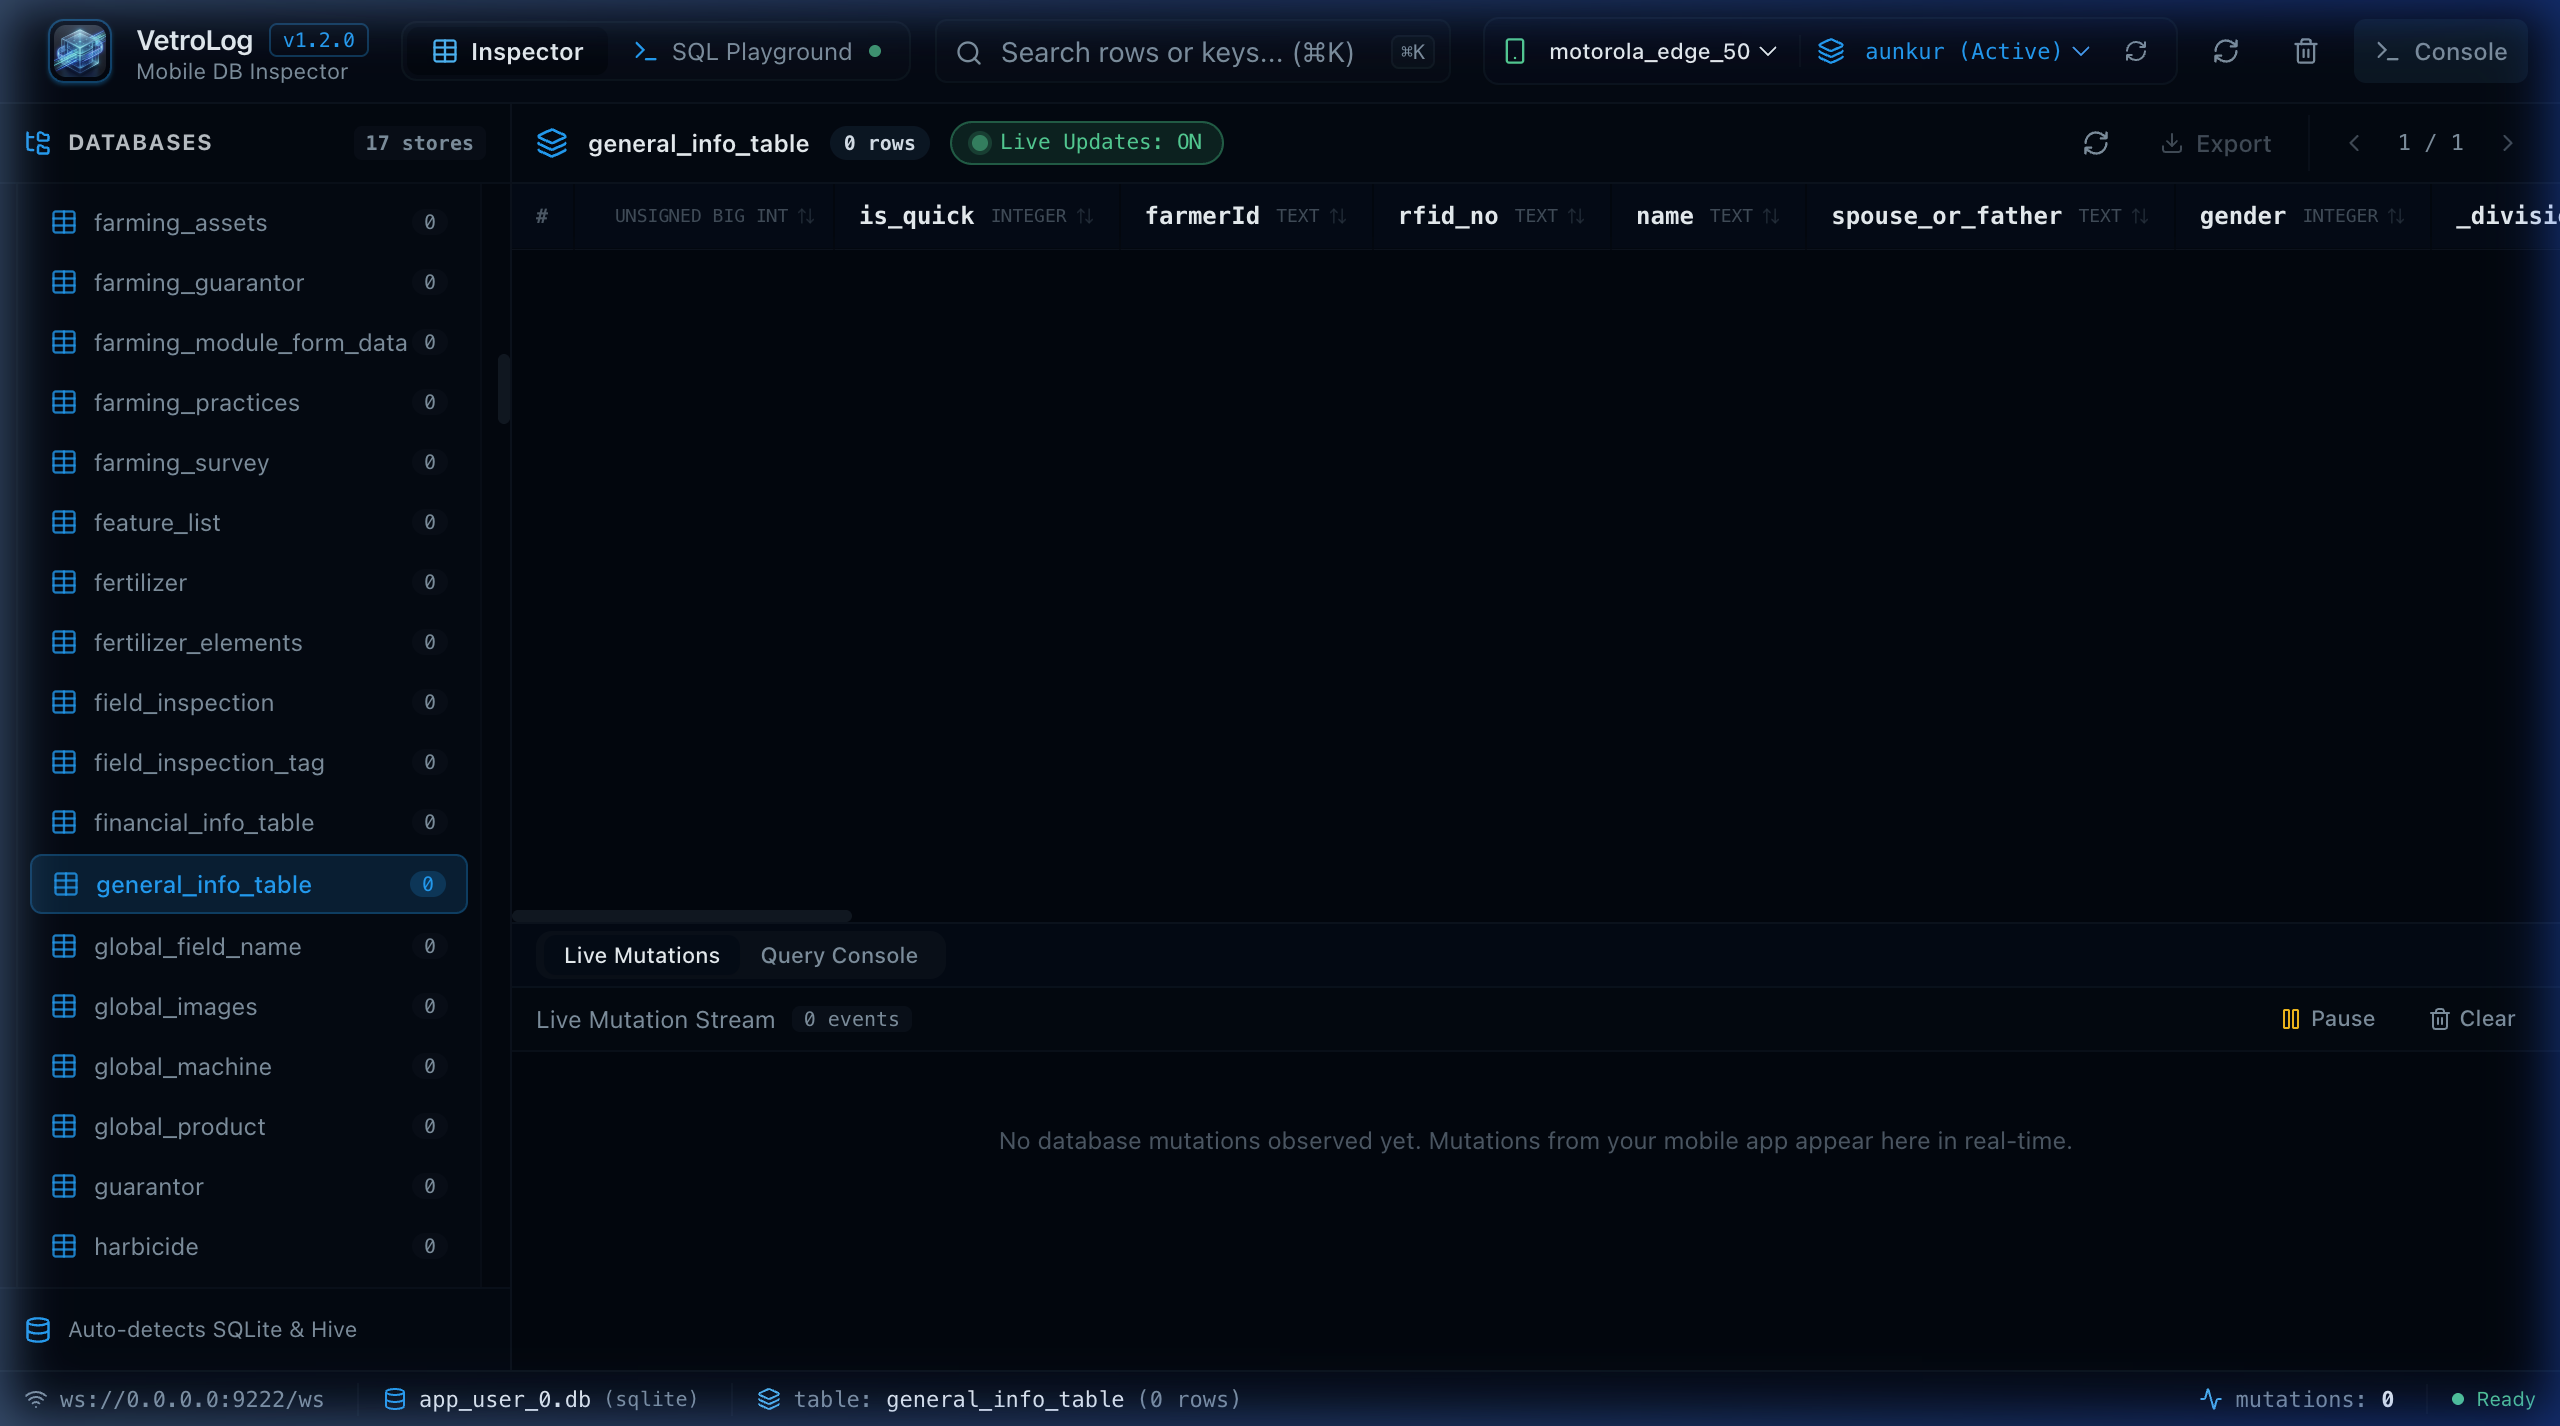
- In the left sidebar, click on any database to expand its tables.
- Click on any table (such as
general_info_table) to view live records in the DataGrid:
Next Steps
- Learn how Real-Time WAL Sync updates your data automatically when the phone writes to the database.
- Explore the Intelligent SQL Playground to execute multi-tab queries and optimize execution with AI.